Accounting and finance are not just about debit and credit anymore. Today, numbers talk. And the people who know how to listen to data are the ones moving faster in their careers. This Power BI accounting guide is written for students and professionals who want to understand data without feeling overwhelmed.
If you are preparing for US CMA, working in finance, or studying accounting, you already deal with Excel, reports, and analysis. Power BI simply takes that work and makes it smarter, faster, and clearer. This guide explains Power BI in very simple words.
Data analytics in finance is no longer optional. Companies expect finance teams to explain numbers, spot trends, and support decisions. That is why data analytics, finance skills and BI for accounting tools are becoming core career skills. Power BI is one of the most widely used tools for this.
This Power BI accounting guide will help you go from zero to confident, step by step.
2. Understanding Power BI
What is Power BI?
Power BI is a business intelligence tool used to analyze data and create interactive reports and dashboards. Think of it as Excel + visualization + automation.
Instead of manually creating reports every month, Power BI lets you connect data, clean it, analyze it, and present it visually in one place. This is why BI for accounting is growing so fast.
Key features and components
Some core features you should know in this Power BI accounting guide:
- Connects to Excel, CSV, databases, and cloud tools
- Cleans and transforms data using Power Query
- Creates calculations using DAX
- Builds charts, tables, and dashboards
- Updates reports automatically
Power BI ecosystem
Power BI has three main parts:
- Power BI Desktop for building reports
- Power BI Service for sharing and collaboration
- Power BI Mobile for viewing reports on a phone
For students and beginners, Power BI Desktop is where everything starts.
3. Getting Started with Power BI
System requirements and setup
Power BI Desktop works on Windows. You need basic RAM and storage. If your system runs Excel well, it can run Power BI.
Installing Power BI Desktop
You can download Power BI Desktop for free from Microsoft and install it like any regular software. When you open it, you see a simple home screen with two main choices. One is to load data such as Excel or CSV files. The other is to start building models, charts, and reports.
This screen is your main workspace. All analysis, visuals, and reporting in Power BI start from here.
Navigating the user interface
- The left side shows report, data, and model views
- The top ribbon has tools for visuals and calculations
- Right side controls visuals and fields
Spend one day just clicking around. Comfort comes fast.

4. Connecting and Importing Data
Supported data sources
Power BI connects with many sources. For accounting and finance, the most common are:
- Excel files
- CSV files
- Accounting software exports
- ERP data
This is where data analytics finance starts to feel real.
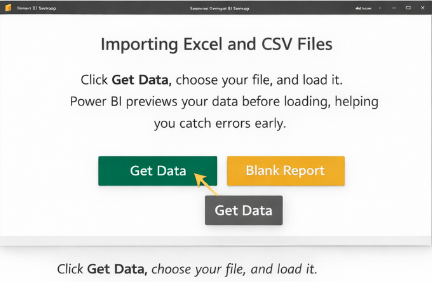
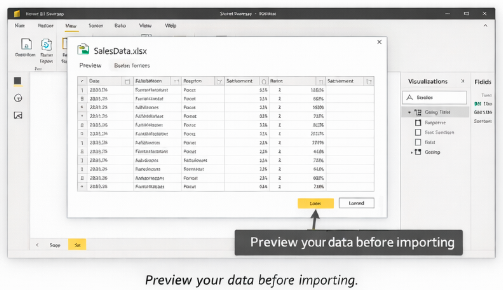
Importing Excel and CSV files
Click Get Data, choose your file, and load it. Power BI previews your data before loading. This helps you catch errors early.
Data transformation basics using Power Query
Power Query is where you clean data. You can:
- Remove blank rows
- Rename columns
- Change data types
- Merge tables
This step is crucial in BI for accounting because raw accounting data is often messy.


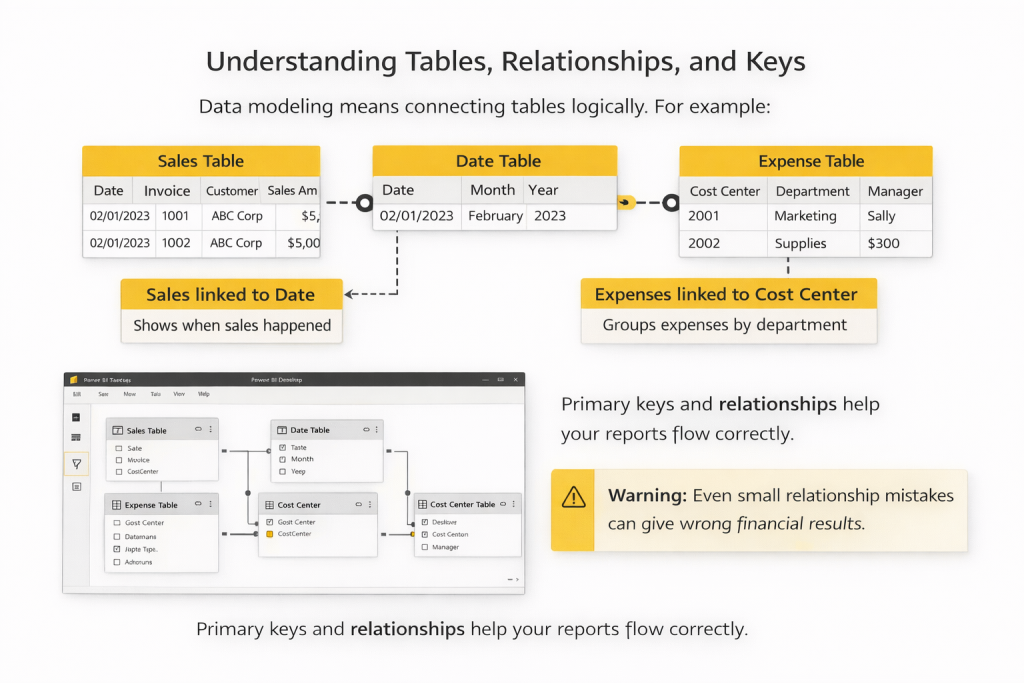
5. Data Modeling Essentials
Data modeling is about connecting tables logically. For example:
- Sales table linked to Date table
- Expense table linked to Cost Center table
Primary keys and relationships help Power BI understand how data flows. This is a key topic in any Power BI accounting guide.
Creating calculated columns and measures
Calculated columns work row by row. Measures calculate totals, averages, and ratios.
For finance students, measures matter more. Examples include:
- Total Revenue
- Gross Margin
- Variance percentages
Once your tables are connected properly and relationships are set, Power BI understands how data is structured. But structure alone is not enough in accounting and finance.
Finance work is about calculations. Totals, averages, margins, growth rates, variances. This is where simple columns are not sufficient. You need formulas that can calculate numbers dynamically based on filters, time periods, and business logic.
To do this, Power BI uses a formula language called DAX.
If you know Excel formulas, you can learn DAX easily. For CMA analytics, DAX is powerful because it helps you create dynamic financial insights.
In Power BI, DAX is mostly used to create measures. Measures are formulas that calculate values like totals, margins, or variances based on the report view.
For example, instead of manually calculating:
- Total revenue
- Profit margin
- Budget vs actual difference
You create a DAX measure once. Power BI then recalculates it automatically when you change the month, department, or cost center. This is why DAX matters in finance roles. It saves time and reduces manual errors.
If you already use Excel formulas like SUM, IF, or AVERAGE, DAX will feel familiar. The logic is the same. The difference is that DAX works across the entire dataset and responds instantly to filters. You don’t need to memorize formulas. You learn a few basics, apply them in reports, and improve with practice.
6. Building Visualizations
Types of visualizations in Power BI
Power BI offers many visuals:
- Tables and matrices for details
- Bar and column charts for comparison
- Line charts for trends
- KPI cards for key metrics

This is where BI for accounting becomes visual storytelling.
Creating and customizing charts
Creating charts in Power BI is mostly drag and drop. You select a visual, drag the required fields into it, and Power BI builds the chart automatically. You can then adjust labels, colors, and formatting using simple options on the side.
You do not need any design background. Power BI is built for finance and accounting users, so it focuses more on clarity and accuracy than fancy visuals.

Best practices for effective data presentation
Keep visuals simple. One chart should answer one question. In data analytics finance, clarity matters more than decoration.
7. Designing Interactive Reports and Dashboards
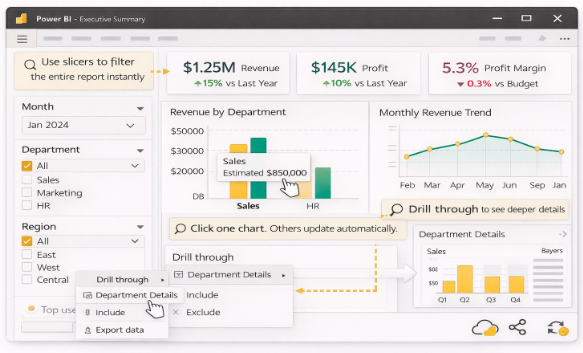
Adding filters, slicers, and drill-throughs
Slicers let users filter by date, department, or region. Drill-through lets users click deeper into data.
This interactivity is why Power BI accounting guide skills stand out in interviews.
Linking visuals for interactivity
When you click one chart, others update automatically. This helps management explore numbers without asking for new reports.
Publishing and sharing reports
Reports can be published online and shared securely. Updates happen automatically when data refreshes.
8. Power BI for Accounting and Finance Applications
Common use cases
Some real examples of BI for accounting include:
- Monthly financial reporting
- Budget vs actual analysis
- Expense tracking
- Revenue trend analysis
These are core CMA analytics applications.
Imagine closing books and having dashboards ready instantly. Or explaining variances visually instead of using long Excel sheets. That is the power of data analytics finance.
Automating routine accounting tasks
Power BI reduces repetitive reporting work. This frees time for analysis and decision-making.
This Power BI accounting guide is not about replacing accountants. It is about upgrading them.
9. Tips, Resources, and Next Steps
Learning resources and community support
Practice matters more than theory. Use sample datasets, join forums and watch short tutorials.
Power BI certifications and career benefits
Power BI skills complement US CMA and finance roles. Recruiters value professionals who understand BI for accounting and CMA analytics.
Staying updated with new features
Power BI updates regularly. Follow official blogs and release notes.
——————————————————————
If you take one thing from this Power BI accounting guide, let it be this. Accounting is no longer just reporting the past. It is about explaining the present and shaping the future.
Power BI helps finance students and professionals speak the language of data. With data analytics finance skills, BI for accounting knowledge, and strong CMA analytics, you become more valuable, more confident, and more future-ready.
Start small. Load one Excel file. Build one chart. Then keep going. Data rewards those who stay curious. If you want to actually apply Power BI, analytics, and financial concepts the way real US CMAs do, The WallStreet School’s CMA (US) program offers offline classes in Delhi and Mumbai with strong practical exposure to core CMA concepts. You don’t just study theory. You work on real dashboards, analysis, and decision-making skills that you can actually use in interviews and on the job.
